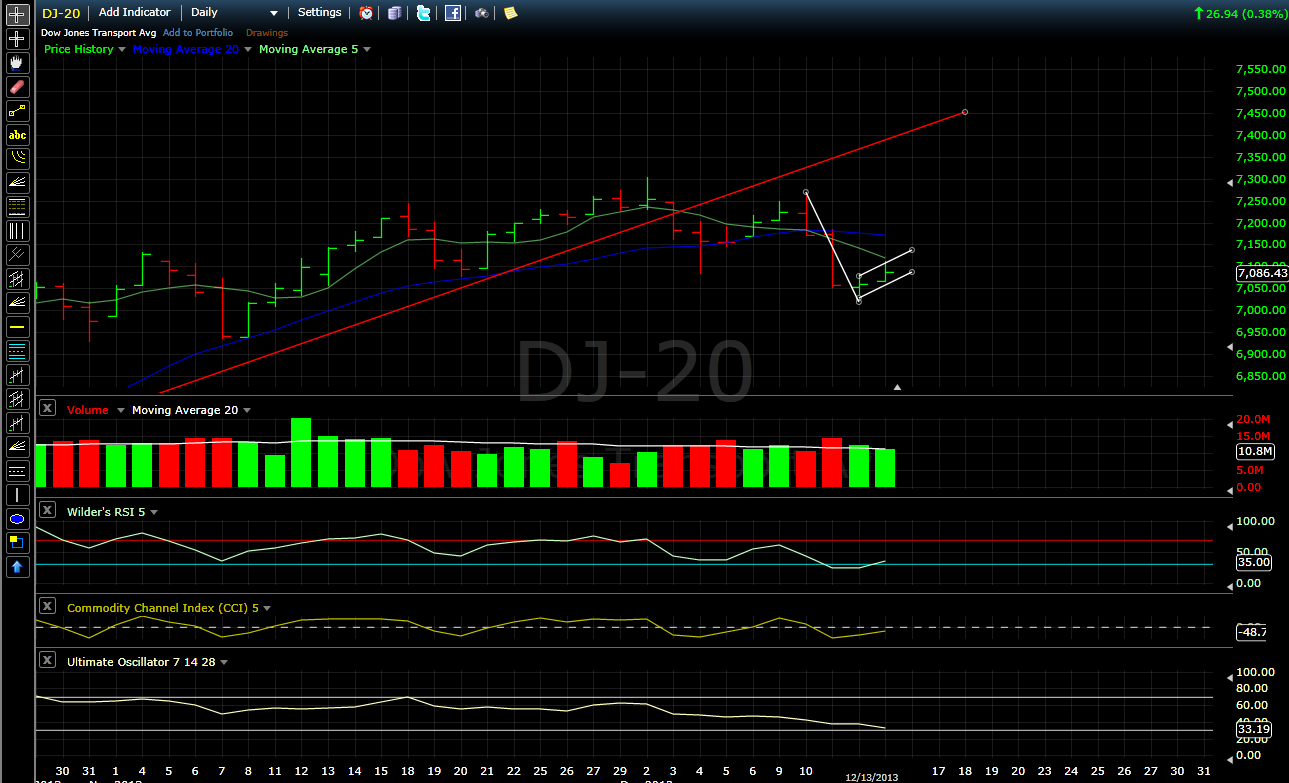
After looking at Friday's price action, it's hard not to call for lower levels in the immediate term. Daily charts on the main indexes show bearish flags, as well as a lack of close above the neckline from what seem to be valid reversal patterns. The S&P 500 and Dow Industrial indexes have volume that favors the sell side - even the two-day flag on the DJT daily chart shows declining buy volume.
Oscillators aren't completely oversold, but they seem poised for their second dips into the area before signaling an oversold market.
The weekly chart, however, points upward....I just don't think this retracement is over quite yet.
Dow Jones Industrial 4 Hour Chart
Dow Jones Transportation Average Daily Chart
S&P 500 Daily Chart


No comments:
Post a Comment