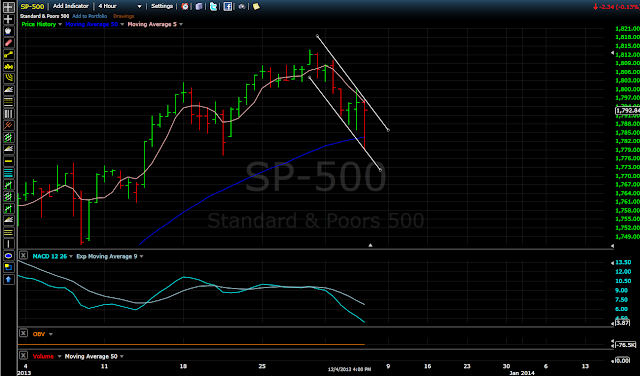
Charting speed lines from the November 7th low of 1746.20 to the last high of 1813.55 paints an interesting picture. Today's had trouble penetrating the first speed line resistance, and has neither reached the next line nor breached it.
Off the bat, I read this as slightly more weakness to come tomorrow, although a bounce off of that second speed line is totally possible.
Off the bat, I read this as slightly more weakness to come tomorrow, although a bounce off of that second speed line is totally possible.
The trend line for the current down wave is pretty convincing on both the 4 hour and Daily charts.
Tomorrow, 1775.60 will be the resistance level set by the second speed line. A bounce as low as 1774.30 will maintain the tentative channel's lower resistance. Upper resistance set by the current down trend appears to be 1795.
S&P 500 Daily Chart
Potential reasons for at least a bounce do appear to exist. The neckline mentioned in a previous post around the 1775 level may have been established with today's low. It has the slight upward trajectory often found in a head and shoulders pattern. If this pattern is forming, the right shoulder may start forming this week.
S&P 500 Daily Chart
OBV still falls with the trend, however the regular volume bar graph shows some sell side increases over the past couple days.
Might see a drop near today's lows tomorrow, and then a bounce up. If it breaks the current downward trend line it will throw a wrench into things for short positions. All of what has happened in the past few days feels like more than a minor pullback. Although, liquidity is plenty via QE, and this seems to continue to have a hold on the market's psyche.
-TWW


No comments:
Post a Comment