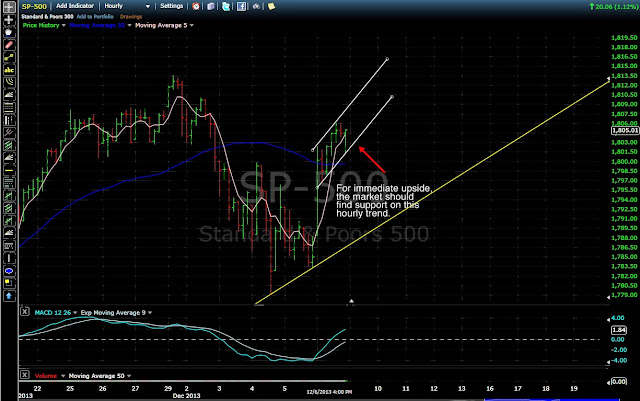
Friday saw an interesting end to the week. From my perspective, its difficult to make a call. I think if there is more upside to be had tomorrow, it really needs to remain above 1800. The 1800-1802 area is offering support on the hourly charts, based on the upward pointing flag.
S&P 500 Hourly Chart
While I attempt to make most decisions based on technical analysis, we can't ignore why this rally occurred. Positive economic data, coupled with the holiday season may spell one more nice wave up.
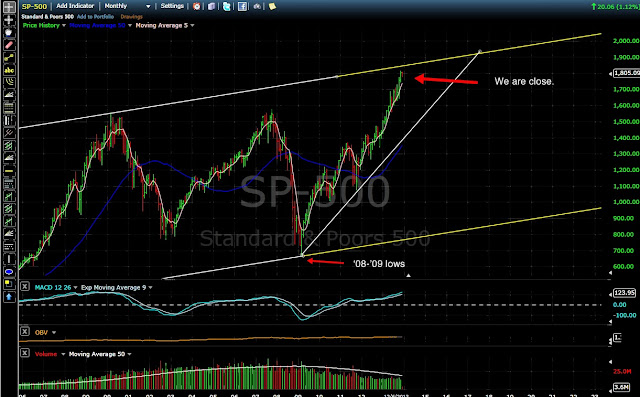
I think it's worth mentioning the monthly chart. I've put a trend channel over the entire S&P 500 index, and the 1850 mark is going to be key (if we get there). This point represents hitting the top of the this tentative super long term channel. If it bounces off, significant downside could occur next year - potentially below 1600. If we break through, the possibilities seem endless.
S&P 500 Monthly Chart
Hopefully we are seeing the beginning of a big push to the 1850 mark at least.
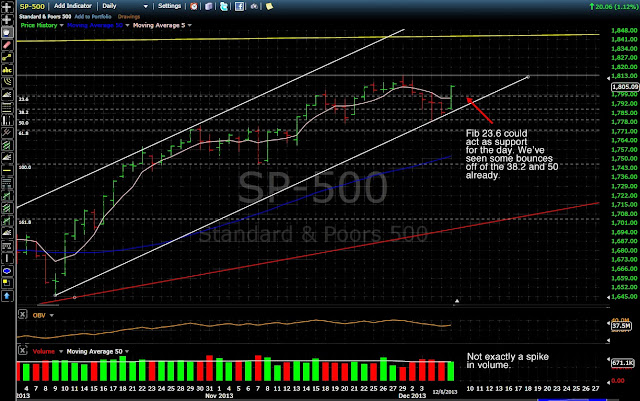
On the daily, I'm looking at fib retracement from the Nov 7 low. We are seeing price action react to this a bit, and the 23.6 level is around 1800, which is serving as support.
If we are seeing an H&S reversal pattern this should roll again soon, although the daily chart below looks bullish to me.
S&P 500 Daily Chart


No comments:
Post a Comment