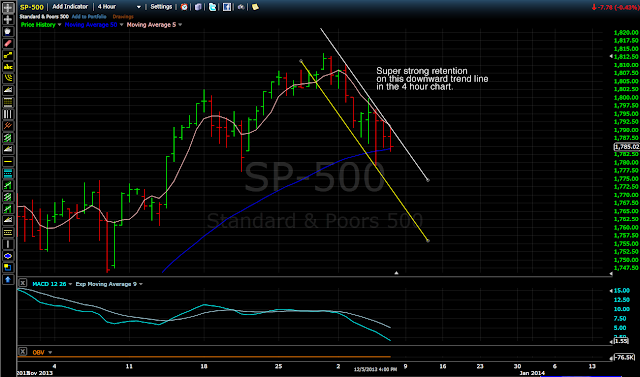
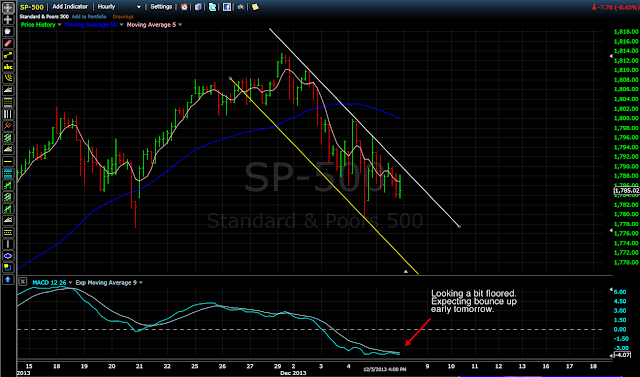
And down we continue to go. Today saw steady downward trends on the short term charts and we closed way below 1790. The current trend line on the daily chart is quite steep, creating a resistance level of 1789/90. Anything above this should worry those playing this wave.
Still watching the speed lines. If anything, today relieved whatever buying pressure existed, and made room for a run down to the next support level.
Right now, support still seems to be the 1775 - 77 area. However, if this level is passed decisively there is opportunity for a drop to 1770/69.
As far as the upside - it's losing credibility for the near term. However, OBV is on its side, and there's the tentative H&S. Tomorrow would be an ideal reversal day to begin forming the right shoulder. Also, yesterday's low seems like it was a bounce off the 50% fib retracement level of the wave from the low of November 7th. Today we stayed above it. This could be a warning that this trend may reverse as soon as tomorrow or Monday.
A trend in motion, tends to stay in motion indeed.
S&P 500 Daily Chart
S&P 500 4 Hour Chart
S&P 500 Hourly Chart


No comments:
Post a Comment