Well, when you're wrong, you're wrong.
While this blog is meant to be a place to post and reflect upon my own analysis, it is also a chronicle of my progression as a self-taught technical analyst. Everyday I learn something new about how financial markets work and it grows increasingly fascinating. Today presented me with one of the most important lessons of all.
Declines of around 1% occured in pretty much all major US indices and this was easily predictable. I, however, suffered from a case of tunnel vision. It was only after I took a small loss that I realized my mistake was in not making myself aware of the other indices. Had I done so, I would have seen clear signals of potential trend reversal.
Kudos to Oscar Carboni for pointing out what I failed to notice:
https://www.youtube.com/watch?v=oi5zj6o9okU#t=337
Speaking of trend reversal!
There are double tops/h&s patterns all over the US indices and it's very compelling. I think we are setting up for a retracement of the wave from october lows. Tomorrow appears to have the potential for an early bounce before pushing downward some more. Strong resistance remains at the 1799/1800 level for the S&P 500 and 1775 returns as a key support. This particular index appears to be forming a double top, but other falling indices are finishing up some H&S patterns and may yank it down.
S&P 500 Daily Chart
S&P 500 4 Hour Chart
S&P 500 Hourly Chart
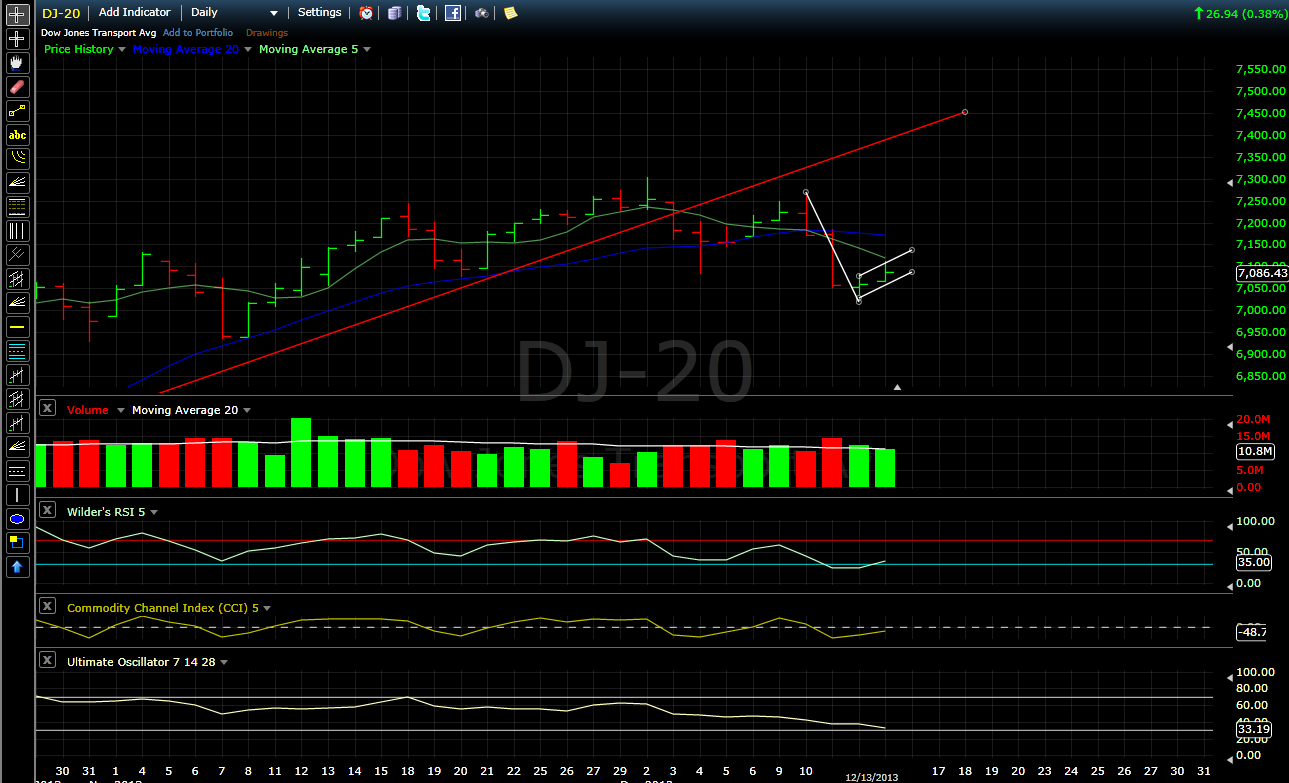
Dow Jones Transportation 4 Hour Chart

Dow Jones Industrial Hourly Chart
Russell 2000 4 Hour Chart